I am in the final stages of wrapping up my book and am hoping, dear readers, some of you might be able to help me.
Michael Mann’s hockey stick temperature graph became the icon of the 2001 Intergovernmental Panel on Climate Change (IPCC) report. It appears in five places in that edition of the Climate Bible – see here for example.
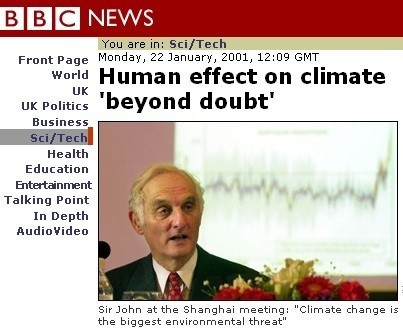
Moreover, when the co-chair of Working Group 1 presented the IPCC’s findings to the media, an enlarged version of this graph was displayed behind him.
It is my understanding that, since then, it has been included in government documents, science textbooks, and other official venues. If you are aware of any such examples, I’d be thrilled to hear about them.
Links to online sources – especially official websites from reputable organizations – would be the most useful to me. Alternatively, scans/digital photographs of pages from textbooks (accompanied by a photograph of the book cover) would also be helpful.
I’m already aware of the instance in which the World Meteorological Association put that graph on the cover of one of its documents (12-page PDF here).
email: noconsensus@gmail.com
A longish update about my book is coming this Thursday.Stayed tuned!