Bitcoin prices continue to look bullish overall. The bitcoin economy is prospering and improving. More upside is likely. Once the current period of low volatility is over, we may see a massive rally that could test or exceed the all-time high of $32.
Only a break below $4.73 would temporarily suspend the bullish outlook.
In our opinion, a breakout of the recent tight trading range is about to happen, possibly within the next 24-48 hours. Why? Because the bollinger bands are at historical lows right now:
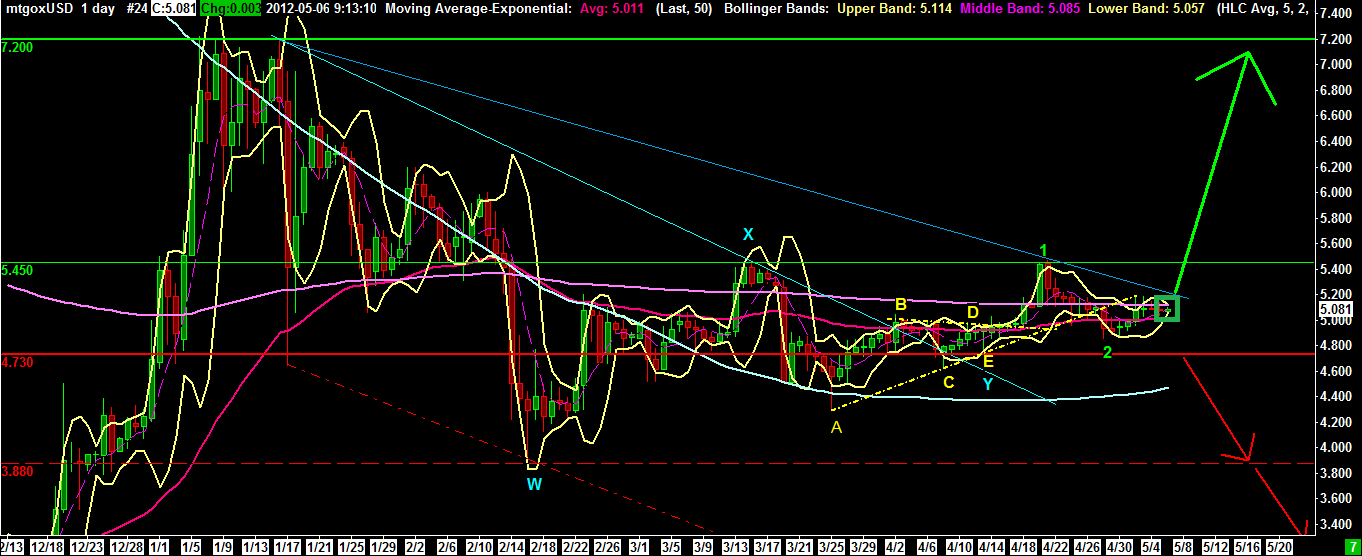
If prices break above $5.2 – $5.23 and this break out is confirmed above $5.45, a big rally may happen. Ideally, $4.95 – $5 should hold as support. Mid term, only a break below $4.73 will turn our view bearish.
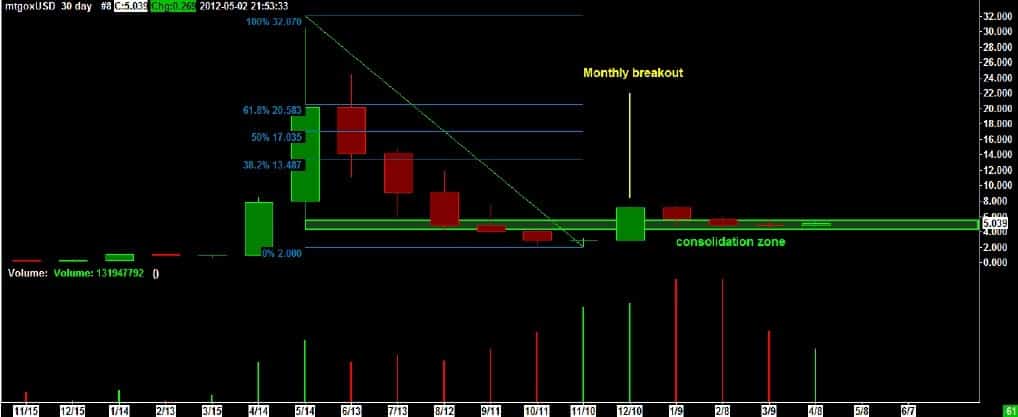
Monthly
As long as the November 2011 low at $1.994 holds, the upward correction can lead to a price target of $17 – $20. Because typically, Elliot Wave corrective patterns retrace 50% or even 61.8% of the preceding move. This would lead to at least 17 $ (50%), or 20.6 $ (61.8%). To date, prices have remained in the consolidation zone since the November / December 2011 breakout.
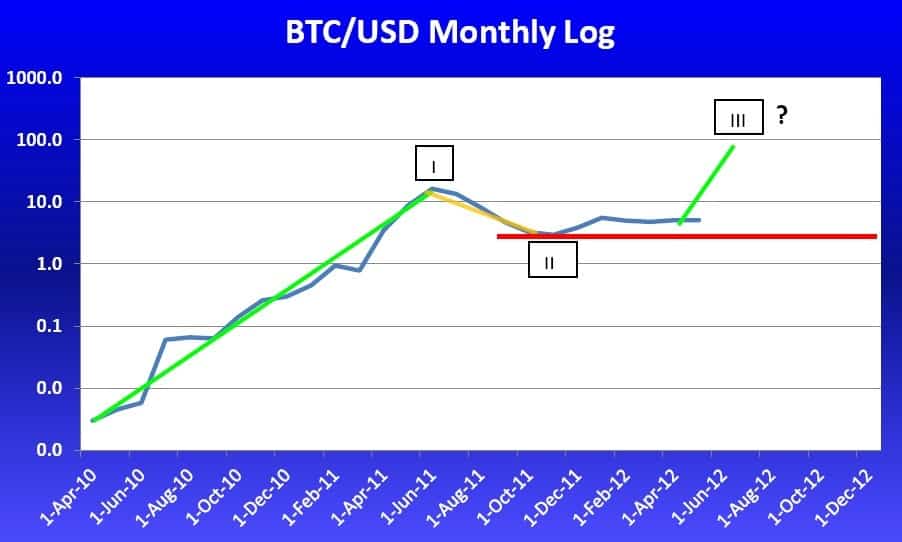
The lead Elliott Wave interpretation projects that if bitcoin prices are indeed in a major wave III up, BTCUSD will likely make new all-time highs (way) above $32. This interpretation will hold true provided that prices stay above the November 2011 low of $1.994 (red line).
The weekly bitcoin charts identifies that Bitcoin prices continue to coil in a very narrow range. Since many weeky, bitcoin prices trade within +- 15% which seems to be a large range, but in fact is a very narrow range in bitcoin history. Most often, swings of +- 50% in four to six weeks have been quite usual. Looking at the weekly logarithmic bitcoin chart below, we continue to see that the breakout has not fully happened. However, the weekly relative strength index has crossed up, which is a bullish indication: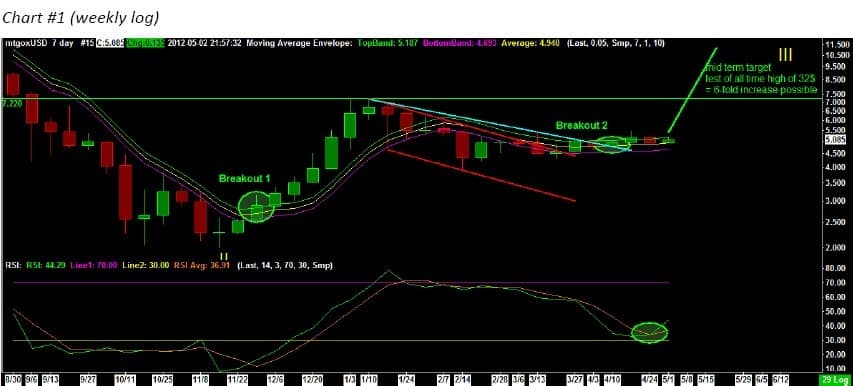
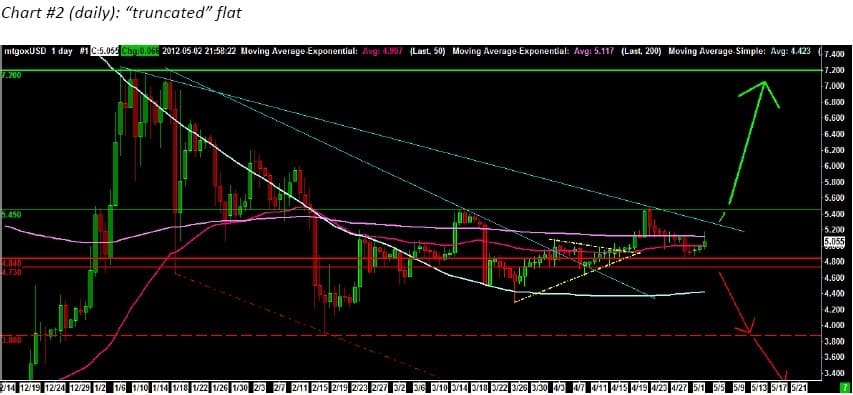
In the daily view, we still favor a “truncated flat” correction or which we can also label as a “double three” correction. Once bitcoin prices have broken above $5.3 (down sloping turquoise trend line) and $5.45, an acceleration of the rally is likely:
Diving one more time frame deeper, the hourly view, taken May 3, could seem a bit outdated. However, it gives a good example of using technical analysis for bitcoin price predictions successfully:
When we look at the updated chart from May 9, 2012, we see that indeed, an initial breakout to the upside happened as predicted before. Thus we see that the rise from $4.73 is impulsive (5 waves i-ii-ii-iv-v) and the late April move is corrective (3 waves a-b-c). This is why we are seeing a higher probability for a continued rally.
Bitcoin chart from May 3, 2012
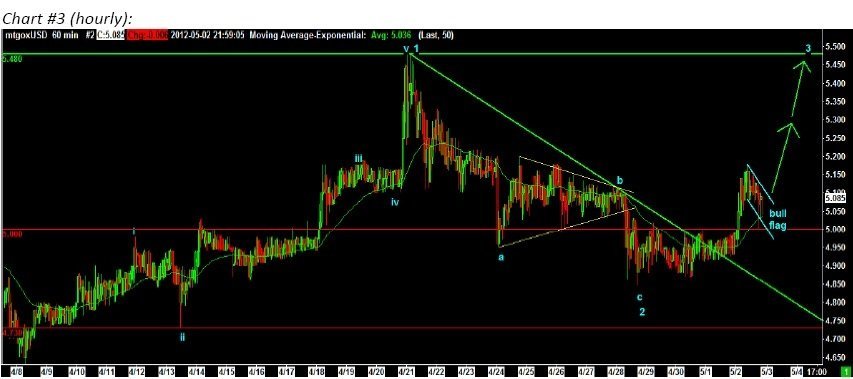
Very recently, we seem to be in yet another – this time a larger and more extended – bull flag. Also here, the most likely resolution of bitcoin prices is UP.
It is also a bullish sign that the recent retest of the $5 mark has held already three times. And the fact that bitcoin prices briefly pierced $5 and then quickly shot above is also a sign of a strong market.
There is a 55/45 probability that the next move is a rally of bitcoin prices.
What if the 45% comes true and the preferred outlook with 55% probability does not materialize? From a trading perspective, this is relatively easy: A break below 4.73 $ will turn the 45% alternate scenario into a lead scenario. In this case, a further decline to much lower levels is the expected result.
But also this would not jeopardize the mid and long term bullish view on bitcoin prices: Once the current consolidation is over, there is a chance that the bitbull comes back with a big
bitbull run.
We summarize:
Resistances
(i) 5.3 – 5.45 $ (medium)
(ii) 7.22 $ (strong)
(iii) 9.5 – 10.5 $ (medium)
(iv) 17 $ (50% Fibonacci retracement, minor)
(v) 20 $ (psychological level and close to 61.8% Fibonacci retracement, strong)
(vi) 31.89 $ (all time high, strong)
Support
(i) 4.95 – 5 $ zone (massive, psychological level and EMA 50, tested again today successfully)
(ii) 4.7 – 4.85 $ (strong)
(iii) 4.3- 4.4 $ (very strong: 200d simple moving average, previous 4.3 $ low)
(iv) 2.6 – 3.86 $ (MASSIVE, broad zone, see above channel discussion)
(v) 2.04 – 1.99 $ (strong)
(vi) 1 $ (psychological)
Disclaimer: This article is not investment advice. This article is an example of what paid subscribers receive. Bitcoin could become one of the best investments in the financial world, but there are significant risks involved related to Bitcoins and, like other financial assets, it is possible to lose money. Always do your own due diligence, and consult your financial adviser before doing any investing. Long-term trading success or positive investments require accepting errors and uncertainty if one wants to forecast probabilities in the future. BullBear Analytics owns and trades bitcoins. Never invest unless you can afford to lose your entire investment! @BitcoinAnalyst